
There is a very specific way oscilloscopes are traditionally introduced to automotive apprentices.
An instructor connects approximately seven leads to an engine.
A waveform appears on the screen that looks like the cardiogram of a caffeinated squirrel.
He squints at it for three seconds.
Points somewhere in the middle.
And says:
“As you can clearly see, we have a problem here.”
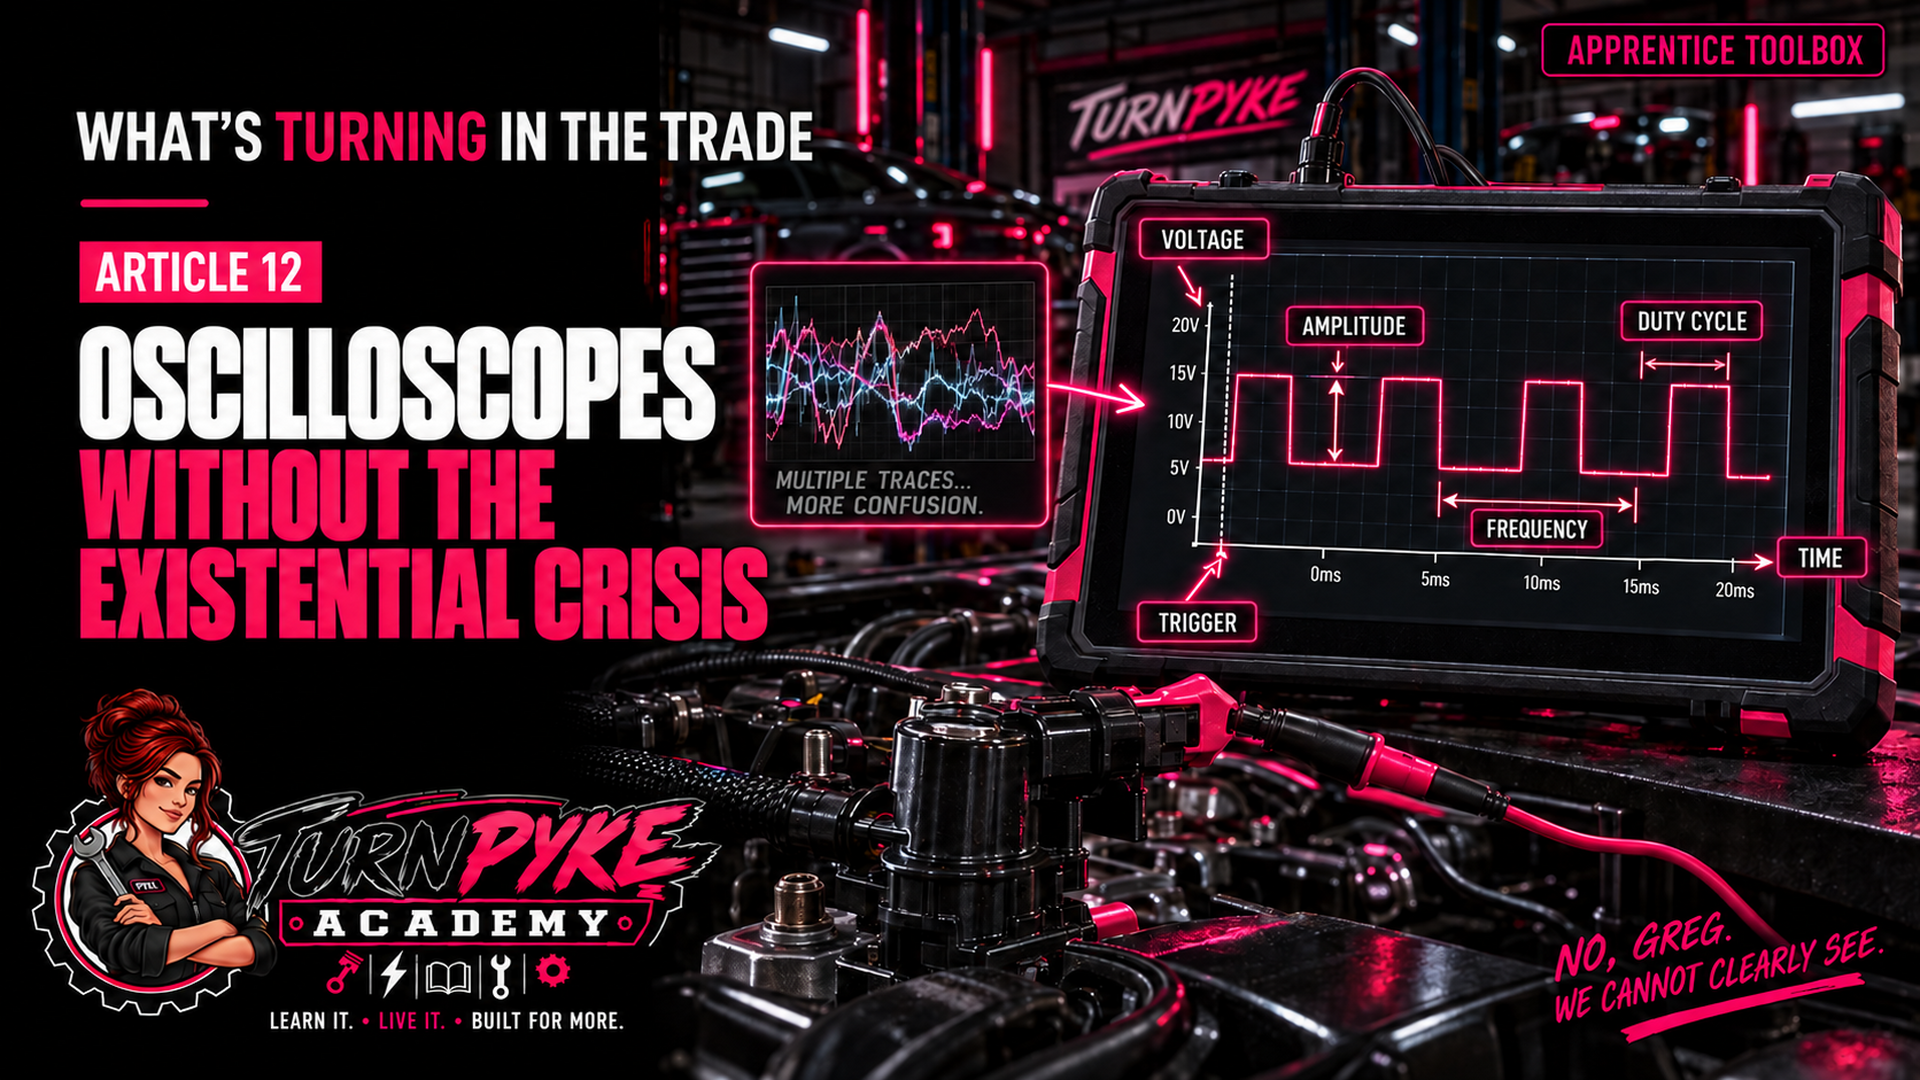
NO, GREG.
WE CANNOT CLEARLY SEE.
I can see seventeen squiggly lines.
I can see colours.
I can see numbers moving at a speed normally associated with aircraft.
And I can see Greg becoming increasingly disappointed that nobody else has apparently developed his supernatural ability to communicate with waveforms.
This is how apprentices become terrified of oscilloscopes.
Which is unfortunate, because a scope is actually one of the coolest diagnostic tools in the shop.
And the basic idea?
Surprisingly simple.
A multimeter gives you a number.
An oscilloscope shows you the story behind that number.
That's it.
That's where we're starting.
Greg can sit down.
1. What happened?
Vehicles became fast.
Not necessarily vehicle speed.
Electrical speed.
Modern vehicle electronics can switch on and off incredibly quickly.
Sensors generate rapidly changing signals.
Fuel injectors are controlled in milliseconds.
Ignition coils charge and discharge.
Electric motors use pulse width modulation.
CAN networks transmit enormous numbers of messages.
Camshaft and crankshaft sensors produce repeating patterns hundreds or thousands of times per minute.
A digital multimeter is brilliant for measuring things like voltage, resistance, current, voltage drop and continuity.
But sometimes the number displayed on the meter does not tell you what happened during the measurement.
An oscilloscope graphs a measured signal against time, allowing technicians to see changes in signal behaviour that a multimeter cannot display.
Imagine a sensor signal should switch between 0 volts and 5 volts.
Your multimeter might display 2.5 V.
Interesting.
But what does that actually mean?
Maybe the signal is switching perfectly between 0 V and 5 V so quickly that the meter is showing you an average.
Maybe it is stuck at 2.5 V.
Maybe it occasionally drops out.
Maybe there is electrical noise.
Maybe the signal is misshapen.
The meter gives you 2.5.
The scope says:
“Would you like to see what actually happened?”
YES.
Thank you.
Finally somebody useful has entered the conversation.
2. How does it work?
Let's remove approximately 95 percent of the terrifying terminology.
An oscilloscope screen is basically a graph.
That's it.
You already survived graphs in school.
We can do this.
There are two main directions.
Up and down represents the measurement
Usually, in automotive diagnosis, that measurement is voltage.
Higher on the screen means higher voltage.
Lower on the screen means lower voltage.
Vertical = voltage.
Easy.
Left to right represents time
The waveform moves across the screen as time passes.
Left = earlier.
Right = later.
That's the entire foundation of oscilloscope diagnosis.
Voltage over time.
Greg could have told us that before opening the four channel crank and cam correlation capture.
But Greg enjoys theatre.
Voltage scale: how tall is the story?
Your first major scope setting is the vertical voltage range.
If you're measuring a 5 volt sensor but your scope is set to display 500 volts, your waveform is going to look approximately three atoms tall.
Technically there.
Entirely useless.
If you set the range too small, the signal may shoot off the top of the screen.
So you choose a range appropriate for what you expect.
Think: How tall do I need the graph to be?
That's your voltage scale.
No existential crisis required.
Timebase: how much time are we looking at?
Timebase simply determines how much time you can see across the screen.
Imagine you're watching traffic.
A very wide time window lets you watch ten minutes of traffic. You see lots of vehicles, but not much detail about each one.
A very narrow time window lets you watch half a second. Now you can see one vehicle in great detail.
The scope works the same way.
If you want to see several engine revolutions, you need a longer time window.
If you want to inspect one tiny ignition event, you zoom into a much shorter time window.
So when you change timebase, ask: How much of the event do I want to see?
That is considerably more useful than memorizing seventeen milliseconds settings.
What is a trigger?
Ah.
The word that has caused generations of apprentices to quietly close the scope and return to their multimeter.
Trigger.
It sounds aggressive.
It isn't.
A trigger simply tells the oscilloscope: Start showing me the waveform when THIS happens.
Imagine you are trying to take a picture of someone jumping.
Without knowing when they will jump, you might take fifty pictures and hope.
Or you could say: Take the picture when their feet leave the ground.
That's basically triggering.
You might tell the scope: When voltage rises past 3 volts, start the capture here.
Now every waveform begins from a predictable event.
Rising trigger: start when voltage crosses the chosen point going upward.
Falling trigger: start when voltage crosses the chosen point going downward.
Congratulations.
You understand triggers.
Somewhere Greg just dropped his laser pointer.
Frequency: how often is this thing happening?
Frequency tells us how many complete cycles occur in a given amount of time.
It is measured in Hertz.
One hertz means one cycle per second.
100 Hz means 100 cycles per second.
This becomes useful when diagnosing repeating signals such as wheel speed sensors, motor control, crankshaft sensors and PWM controlled devices.
Instead of thinking “OH GOD FREQUENCY,” think: How often is this event repeating?
Much friendlier.
Duty cycle: how long is it ON?
Imagine a signal that switches on and off repeatedly.
Duty cycle tells us what percentage of each cycle the signal spends in one state.
Signal ON half the time and OFF half the time: 50 percent duty cycle.
Signal ON three quarters of the time: 75 percent duty cycle.
Signal ON one quarter of the time: 25 percent duty cycle.
That's it.
PWM
Pulse Width Modulation allows a module to control the average energy delivered to a device by switching the circuit rapidly on and off.
Instead of saying “Motor gets half voltage,” the controller might provide full voltage in pulses but vary how long the circuit remains on during each cycle.
This can control fan speed, fuel pump operation, solenoids, lighting, heaters, actuators and electric motors.
Your multimeter might show some averaged voltage.
The oscilloscope lets you see ON, OFF, ON, OFF and exactly how long each part lasts.
Once again: Meter = number. Scope = story.
What does a good waveform look like?
Here is where I want to murder another terrible training habit.
People love showing apprentices a waveform and asking: “Is this good?”
Good compared to WHAT?
A waveform is only useful when you understand what the component is supposed to do.
Before deciding a waveform is wrong, ask:
What type of sensor is this?
What voltage should it produce?
What should make the signal change?
How often should it change?
What should the pattern look like?
Do I have a known good waveform?
THEN compare.
Do not stare at mystery spaghetti and diagnose based on vibes.
Let's use a crankshaft sensor
A crankshaft position sensor creates a repeating signal as the crankshaft rotates.
Depending on sensor design, the waveform may look very different.
A Hall effect sensor might produce a digital square type signal.
A magnetic variable reluctance sensor may produce an alternating waveform whose amplitude changes with speed.
Imagine one tooth on the reluctor is damaged.
The signal may repeat beautifully, beautifully, beautifully, then: weird little bastard.
Then back to normal.
Your multimeter may average the whole mess into a perfectly respectable looking number.
The scope lets you point directly at the weird little bastard.
THAT is why we own the scope.
Cam and crank correlation
For beginners, cam and crank correlation means something much simpler than Greg makes it sound.
We are comparing two signals against each other in time.
Because the camshaft and crankshaft have a mechanical relationship through the timing system, those signals should maintain a predictable relationship.
If mechanical timing changes, the relationship between those signals can change.
That does not mean “look at waveform, immediately condemn timing chain.”
You still need known good information, correct setup, service information and understanding of the engine.
But the scope allows you to compare electrical evidence of mechanical position.
Which is fucking cool.
There. I said it.
CAN communication
Remember the module group chat?
A scope lets us physically see that conversation happening.
CAN High and CAN Low can be viewed simultaneously, and waveform inspection can reveal problems involving noise, ringing and signal distortion that resistance measurements alone cannot identify.
Your resistance test may tell you approximately 60 ohms.
Lovely.
But the scope may show noise, distortion, intermittent dropouts, abnormal voltage levels or signal reflections.
Remember: 60 ohms is a clue. It is not a certificate of perfect mental and physical health for the entire network.
CAN Networks: The Director's Cut already yelled at us about this.
3. Why should technicians care?
Because some faults happen too quickly for a meter to show you.
Imagine a 5 volt sensor signal momentarily drops to 0 V for 10 milliseconds.
Your multimeter might never visibly react.
The ECU might absolutely notice.
DTC sets.
Vehicle stumbles.
Customer says: “It only does it occasionally.”
Naturally.
Because intermittent faults respect no technician and absolutely understand flat rate.
With a scope, you may be able to capture that brief dropout.
And now you have evidence.
That is huge.
A scope lets you test components while they are actually operating
You can watch injector control, ignition operation, sensor signals, network communication, current draw and actuator commands.
That means the fault has fewer places to hide.
Which is unfortunate for the fault.
I feel nothing.
Current clamps make scopes even cooler
A current clamp allows you to graph current over time.
Now we can see how much current an electrical component draws during operation.
Starter current can be useful for relative compression testing because starter load changes as each cylinder reaches compression.
Strong cylinder? Starter works harder.
Weak cylinder? Starter load changes.
And suddenly we are investigating mechanical engine condition through an electrical current waveform.
Again: fucking cool.
Greg could have led with this.
Pressure transducers enter the chat
A pressure transducer converts pressure into an electrical signal the scope can graph.
Now you can potentially examine cylinder pressure, intake manifold pressure, exhaust pressure or fuel pressure and compare those pressure events against crankshaft position, camshaft position, ignition events and injector commands.
At this point the oscilloscope stops being “electrical tool” and becomes “show me what the vehicle is doing over time” tool.
That's the better way to think about it.
Do I need four channels immediately?
No.
Please do not begin here.
You do not learn to drive by entering the Nurburgring.
Start with one channel.
Capture battery voltage while cranking, a simple sensor, a PWM command, one injector or one wheel speed sensor.
Learn vertical scale, timebase and trigger.
Then add another channel.
Nobody gets extra apprenticeship points for opening all four channels and creating a screen that looks like somebody dropped a box of Christmas lights down a staircase.
4. What should an apprentice remember?
If you remember nothing else:
An oscilloscope shows you how a signal changes over time.
Vertical: measurement.
Horizontal: time.
Then ask:
How high does it go? Amplitude.
How often does it repeat? Frequency.
How long is it switched on? Duty cycle.
When do I want the scope to begin displaying the event? Trigger.
You do not need to memorize every scope button.
You need to understand: What question am I asking the circuit?
Because that determines how you set up the scope.
Start simple
Your first capture does not need to diagnose an intermittent CAN FD problem occurring only while lane keep assist is active during a full moon.
Start with battery voltage.
Put the leads on the battery.
Crank the engine.
Watch voltage change over time.
Congratulations.
You just used an oscilloscope.
Nobody died.
Greg is devastated.
And never forget known good
The most dangerous waveform is not necessarily the ugly one.
It's the waveform somebody confidently calls bad without knowing what normal looks like.
Compare against service information, known good vehicle, reference waveform or manufacturer specification.
Because “it looks funny” is not a diagnostic conclusion.
Although it is occasionally an excellent starting observation.
5. The C of Q Connection
Your C of Q is not going to place a four channel scope in front of you and ask you to troubleshoot an intermittent waveform live.
Thankfully.
But the principles underneath scope diagnosis are absolutely testable.
Understand voltage, current, resistance, frequency, duty cycle, PWM, digital signals, analog signals, sensor operation, actuator control, crankshaft sensors, camshaft sensors, wheel speed sensors, network communication and diagnostic strategy.
Example
A Hall effect crankshaft position sensor intermittently loses its signal for only a few milliseconds while the engine is running.
Which tool would BEST allow the technician to capture and view the signal dropout?
A. Test light
B. Ohmmeter
C. Oscilloscope
D. Hydrometer
If anybody selects D, I am coming to your house.
Correct Answer: C. Oscilloscope.
Why?
Because the fault involves a rapidly changing electrical signal and occurs for a very short period of time.
The scope displays voltage against time and can capture that brief event.
A digital multimeter might average the changing signal or update too slowly for the short dropout to be obvious.
Another one
A module controls a cooling fan using pulse width modulation.
Which measurement would BEST indicate how long the control circuit is commanded ON during each cycle?
Duty cycle.
That's what duty cycle tells us.
Not mystery waveform percentage.
Not Greg's favourite number.
Percentage of the cycle spent in the specified state.
Once you understand that, PWM questions become much less intimidating.
6. Sources
PicoScope Automotive Scope School: Introduction
PicoScope Automotive: Timebase
https://www.picoauto.com/library/picoscope-automotive-training/knowledge-base/timebase
PicoScope Automotive: Reference Waveform Library
PicoScope Automotive: CAN and CAN FD Bus Decoding
PicoScope 7: The Basics
https://www.youtube.com/watch?v=xsxQbG0eJls
OEM SERVICE INFORMATION WINS.
Before connecting to an unfamiliar circuit, know what you are measuring, expected voltage, correct connection point, circuit type, safe testing procedure and whether special probes or attenuation are required.
Do not connect your scope to something because “I saw Greg do it once.”
Greg also stood directly in front of the projector for half the lesson.
His judgement is questionable.
7. Next Step
DAILY TORQUE
A technician measures a rapidly switching control circuit with a digital multimeter and reads 6.2 volts. Service information states the circuit is pulse width modulated between 0 volts and battery voltage.
What is the BEST next test to determine how the circuit is actually being controlled?
A. Measure resistance with the circuit operating
B. View the control signal with an oscilloscope
C. Replace the controlled component based on the 6.2 volt reading
D. Disconnect the battery and check circuit continuity
Correct Answer: B. View the control signal with an oscilloscope.
Why?
Because the multimeter may be displaying an average of a signal that is rapidly switching between two voltage levels.
The oscilloscope lets the technician see actual voltage levels, switching pattern, frequency, duty cycle and possible dropouts or distortion.
A is incorrect because resistance measurements are not performed on an energized operating circuit.
Please do not teach your ohmmeter new and exciting ways to die.
C assumes the 6.2 volt reading proves a component fault.
It does not.
Parts cannon stays home.
D may prove continuity, but it does not show how the circuit behaves while operating.
Apprentice Takeaway: When the signal changes faster than your meter can explain, let the scope show you the story.
And if oscilloscopes have previously made you feel like everybody else in the room received a secret handbook that you somehow missed:
You didn't.
Somebody just skipped the part where they explained what the bloody graph meant.
At TurnPyke Academy, we do not begin scope training with four channels, seven waveforms, a pressure transducer, CAN decoding, cylinder overlay and Greg pointing at pixel number 4,827 saying: “There. Obviously.”
We start with voltage over time.
Then we build.
One signal.
One question.
One answer.
Until eventually you look at the caffeinated squirrel cardiogram and realize:
Oh shit.
I actually know what I'm looking at.
And THAT is how this stuff should be taught.
Not by making apprentices feel stupid for not understanding something nobody bothered to properly explain.
Greg has been dismissed.
Class may now begin.
Knowledge. Confidence. Drive.